Published on
18 January 2023
by
Shaun Turney.
Revised on
10 November 2023.
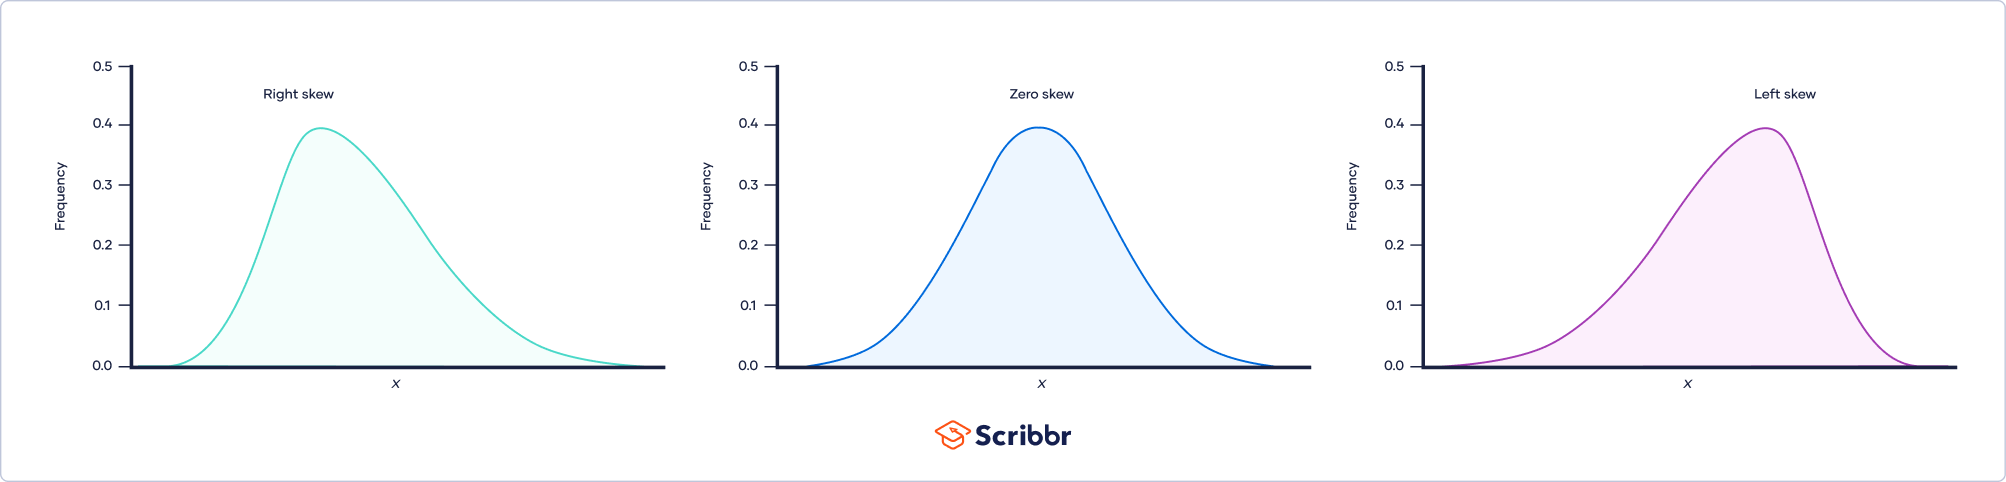
Skewness is a measure of the asymmetry of a distribution. A distribution is asymmetrical when its left and right side are not mirror images.
A distribution can have right (or positive), left (or negative), or zero skewness. A right-skewed distribution is longer on the right side of its peak, and a left-skewed distribution is longer on the left side of its peak:
You might want to calculate the skewness of a distribution to:
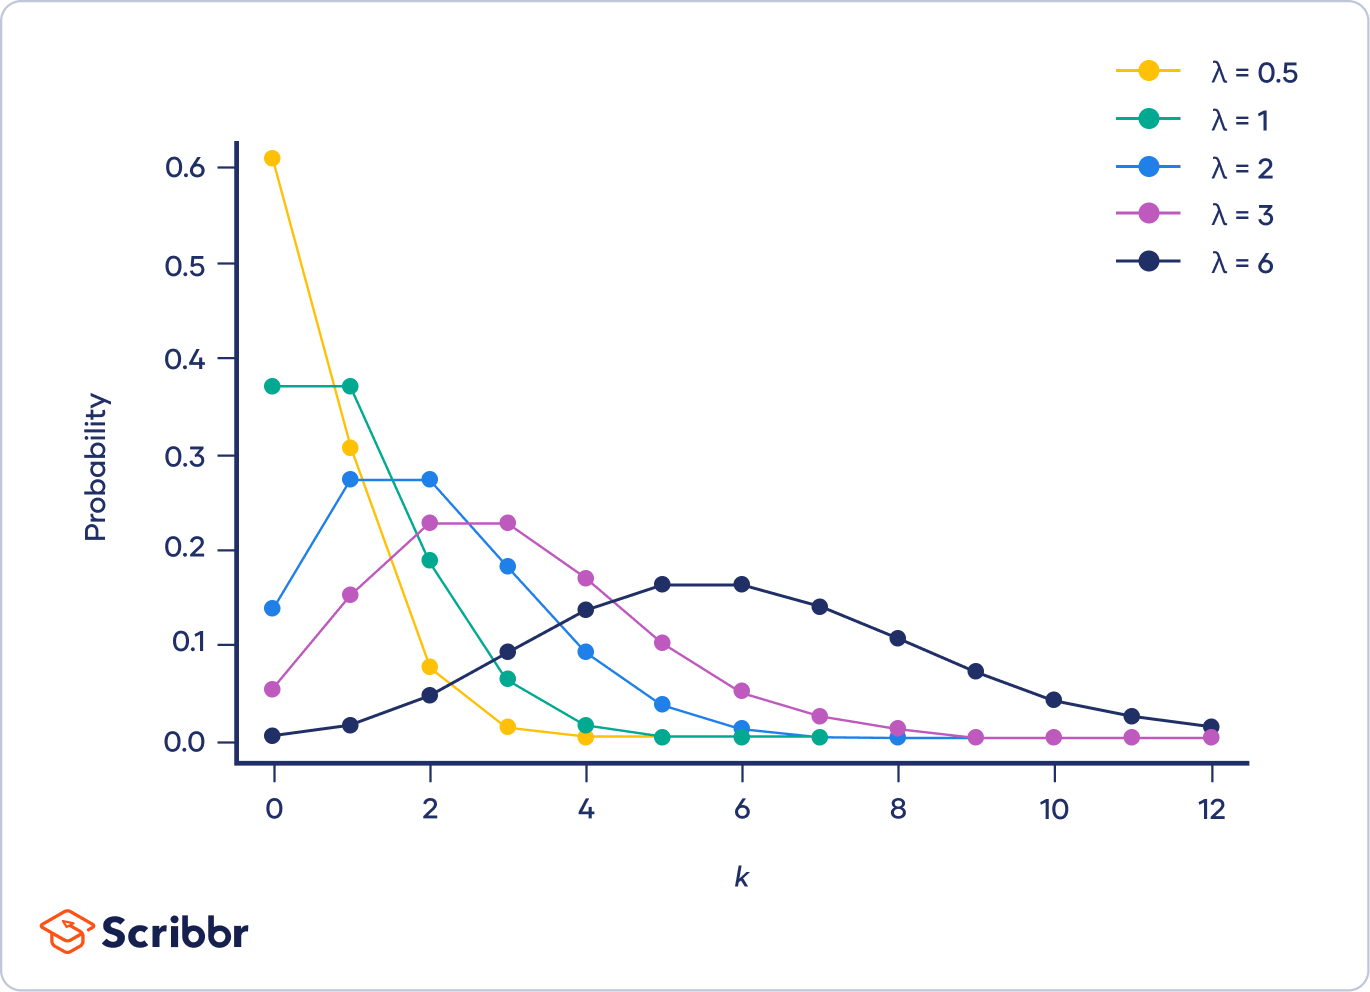
A Poisson distribution is a discrete probability distribution. It gives the probability of an event happening a certain number of times (k) within a given interval of time or space.
The Poisson distribution has only one parameter, λ (lambda), which is the mean number of events. The graph below shows examples of Poisson distributions with different values of λ.
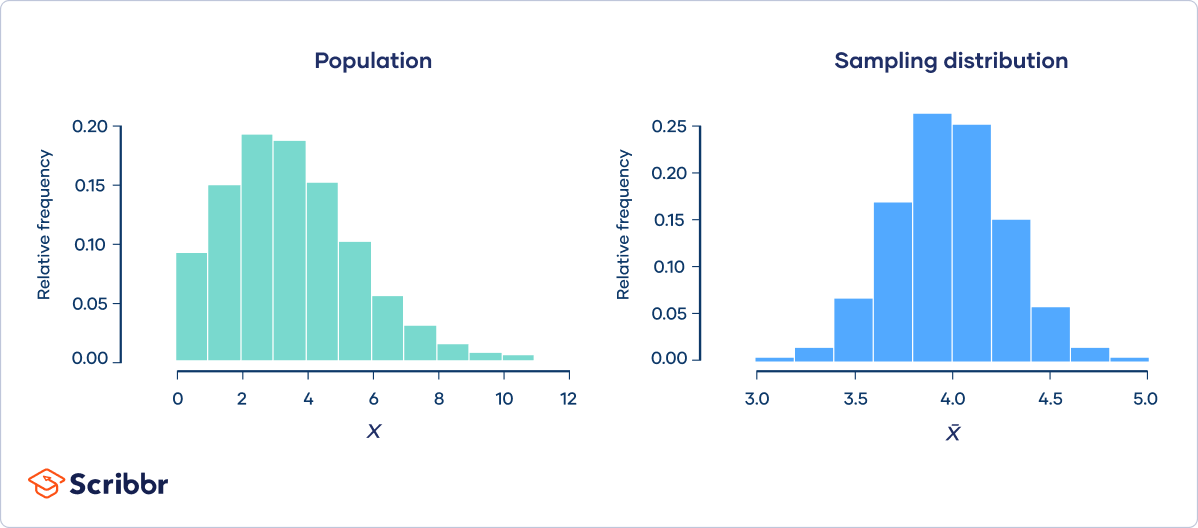
The central limit theorem states that if you take sufficiently large samples from a population, the samples’ means will be normally distributed, even if the population isn’t normally distributed.
Example: Central limit theoremA population follows a Poisson distribution (left image). If we take 10000 samples from the population, each with a sample size of 50, the sample means follow a normal distribution, as predicted by the central limit theorem (right image).
Degrees of freedom, often represented by v or df, is the number of independent pieces of information used to calculate a statistic. It’s calculated as the sample size minus the number of restrictions.
Degrees of freedom are normally reported in brackets beside the test statistic, alongside the results of the statistical test.
Example: Degrees of freedomSuppose you randomly sample 10 American adults and measure their daily calcium intake. You use a one-sample t test to determine whether the mean daily intake of American adults is equal to the recommended amount of 1000 mg.
The test statistic, t, has 9 degrees of freedom:
df = n − 1
df = 10 − 1
df = 9
You calculate a t value of 1.41 for the sample, which corresponds to a p value of .19. You report your results:
‘The participants’ mean daily calcium intake did not differ from the recommended amount of 1000 mg, t(9) = 1.41, p = 0.19′.
Published on
15 June 2022
by
Shaun Turney.
Revised on
18 July 2024.
A systematic review is a type of review that uses repeatable methods to find, select, and synthesise all available evidence. It answers a clearly formulated research question and explicitly states the methods used to arrive at the answer.
Example: Systematic reviewIn 2008, Dr Robert Boyle and his colleagues published a systematic review in the Cochrane Database of Systematic Reviews.
They answered the question ‘What is the effectiveness of probiotics in reducing eczema symptoms and improving quality of life in patients with eczema?’
In this context, a probiotic is a health product that contains live microorganisms and is taken by mouth. Eczema is a common skin condition that causes red, itchy skin.
They used systematic methods to find, select, and synthesise all available evidence, and they described these methods in detail in their article. Based on the evidence, Boyle and colleagues concluded that probiotics cannot be recommended for reducing eczema symptoms or improving quality of life in patients with eczema.